دوشنبه 26 شهریور
تحلیل تکنیکال بیتکوین (چارت یک ساعته )
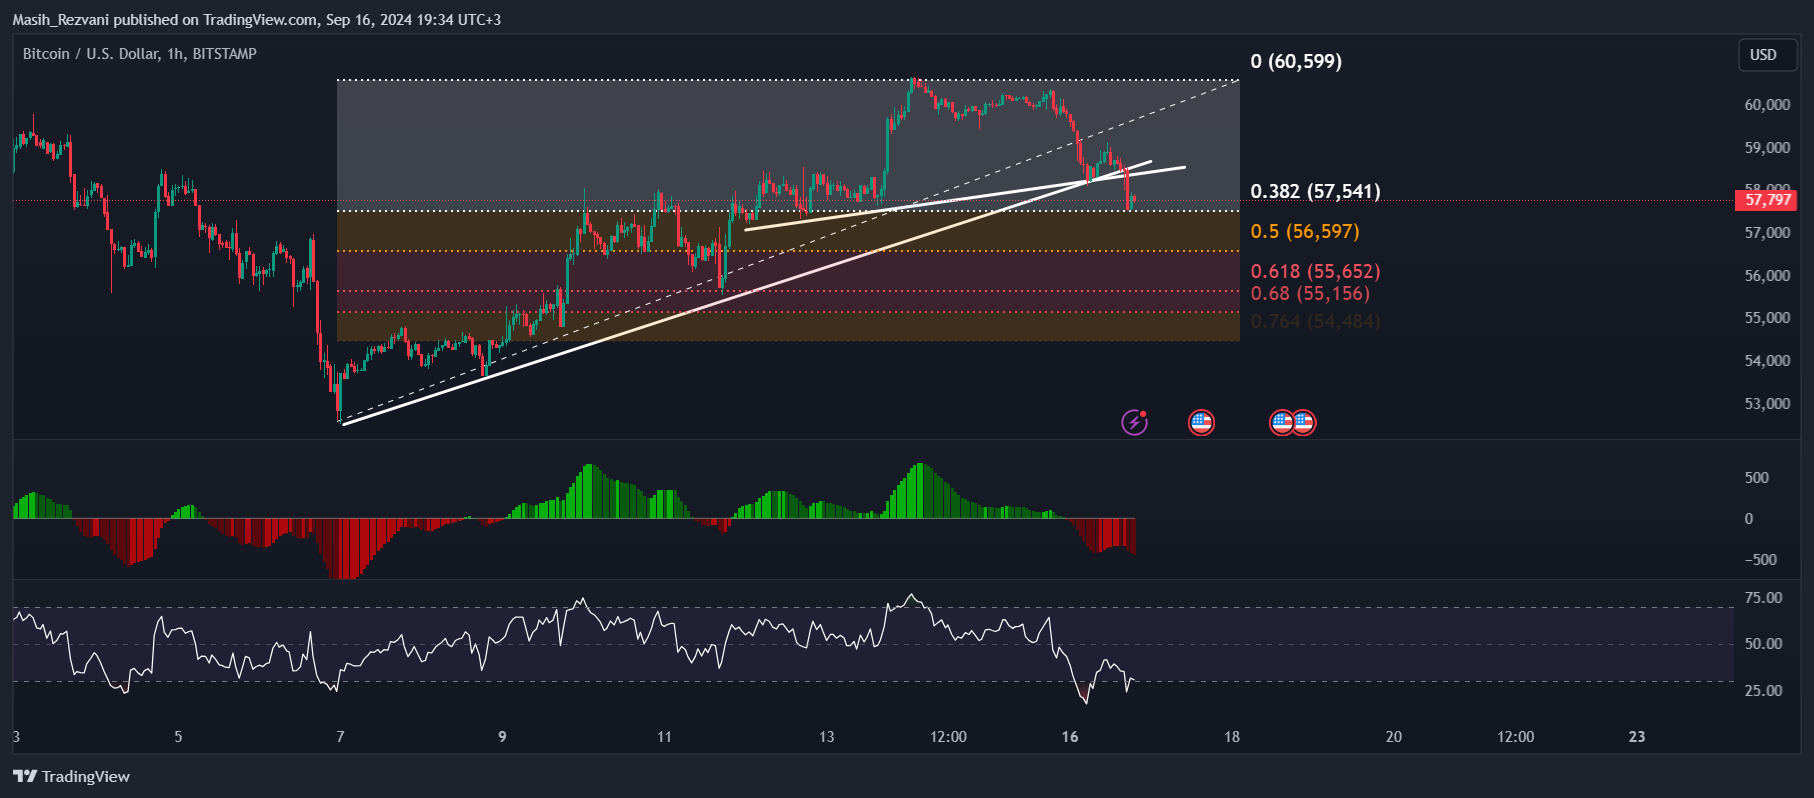
چارت ارائهشده شامل چندین ابزار تکنیکال است که به تحلیل وضعیت فعلی بیتکوین کمک میکند.
ابزارهای تکنیکال استفادهشده:
فیبوناچی اصلاحی:
این ابزار برای بررسی سطوح حمایت و مقاومت احتمالی استفاده شده است.
سطح 0.382 فیبوناچی در قیمت 57,541 دلار نشاندهنده یک حمایت مهم است.
سطح 0.5 فیبوناچی در قیمت 56,597 دلار و سطح 0.618 در 55,652 دلار دیگر سطوح حمایتی کلیدی هستند.
اندیکاتور MACD
هیستوگرام MACD نشاندهنده کاهش قدرت خریداران و احتمال ادامه کاهش قیمت است.
اگر هیستوگرام به سمت منفی حرکت کند و فاصله خطوط MACD افزایش یابد، این نشان از روند نزولی دارد.
اندیکاتور RSI (شاخص قدرت نسبی):
RSI در حال حاضر در محدوده میانه است که نشاندهنده عدم وجود شرایط اشباع خرید یا اشباع فروش است.
تا زمانی که RSI به زیر 50 است، احتمال ادامه کاهش قیمت وجود دارد و در صورتی که به بالای 50 برود، احتمال افزایش قیمت بالا میرود.
تحلیل کلی:
شکست خط روند صعودی نشاندهنده فشار فروش و احتمال تغییر روند به سمت نزولی است.
سطوح فیبوناچی نشان میدهد که بیتکوین به سمت سطح 0.382 نزدیک شده و در صورت شکسته شدن این سطح، احتمال رسیدن به 56,597 و سپس 55,652 وجود دارد.
پیشنهاد معاملاتی:
سناریوی فروش (Sell):
نقطه ورود: در صورت شکست واضح سطح 57,541 دلار و تثبیت قیمت زیر این سطح.
حد سود (Take Profit): 56,597 دلار (هدف اول) و 55,652 دلار (هدف دوم).
حد ضرر (Stop Loss): در صورت بازگشت قیمت به بالای 58,000 دلار.
سناریوی خرید (Buy):
نقطه ورود: اگر قیمت موفق به بازگشت به بالای سطح 58,000 دلار شود.
حد سود (Take Profit): 59,000 دلار (هدف اول) و 60,000 دلار (هدف دوم).
حد ضرر (Stop Loss): در صورت بازگشت قیمت به زیر 57,500 دلار.
نتیجهگیری:
با توجه به شکست خط روند صعودی و قرار گرفتن قیمت در سطوح حمایتی فیبوناچی، معاملهگران باید به رفتار قیمت در سطح 57,541 دلار دقت کنند. در صورت شکست این سطح، احتمال ادامه روند نزولی وجود دارد، در حالی که در صورت بازگشت قیمت، میتوان به ادامه روند صعودی امیدوار بود.
Bitcoin Technical Analysis (1-hour chart)
The presented chart includes several technical tools that help analyze the current state of Bitcoin.
Technical tools used:
Fibonacci Retracement:
This tool is used to identify potential support and resistance levels.
The 0.382 Fibonacci level at $57,541 serves as an important support level.
The 0.5 Fibonacci level at $56,597 and the 0.618 level at $55,652 represent other key support levels.
MACD Indicator:
The MACD histogram indicates a weakening buying power and the possibility of further price declines.
If the histogram turns negative and the MACD lines diverge, it signals a bearish trend.
RSI Indicator (Relative Strength Index):
The RSI is currently in the middle range, indicating that neither overbought nor oversold conditions are present.
As long as the RSI remains below 50, there is a higher likelihood of price declines, and if it moves above 50, the probability of price increases rises.
Overall Analysis:
The break of the ascending trendline indicates selling pressure and the potential for a bearish trend reversal.
Fibonacci levels suggest that Bitcoin is approaching the 0.382 level, and if this level breaks, the price might drop to $56,597 and then to $55,652.
Trade suggestions:
Sell Scenario:
- Entry Point: If the price breaks below $57,541 and stabilizes under this level.
- Take Profit (TP): $56,597 (first target) and $55,652 (second target).
- Stop Loss (SL): If the price rises back above $58,000.
Buy Scenario:
- Entry Point: If the price successfully recovers above $58,000.
- Take Profit (TP): $59,000 (first target) and $60,000 (second target).
- Stop Loss (SL): If the price falls below $57,500.
Conclusion:
Considering the break of the ascending trendline and the proximity of the price to Fibonacci support levels, traders should closely monitor the price action at $57,541. If this level breaks, the bearish trend may continue, while a price recovery could signal the resumption of the bullish trend.


