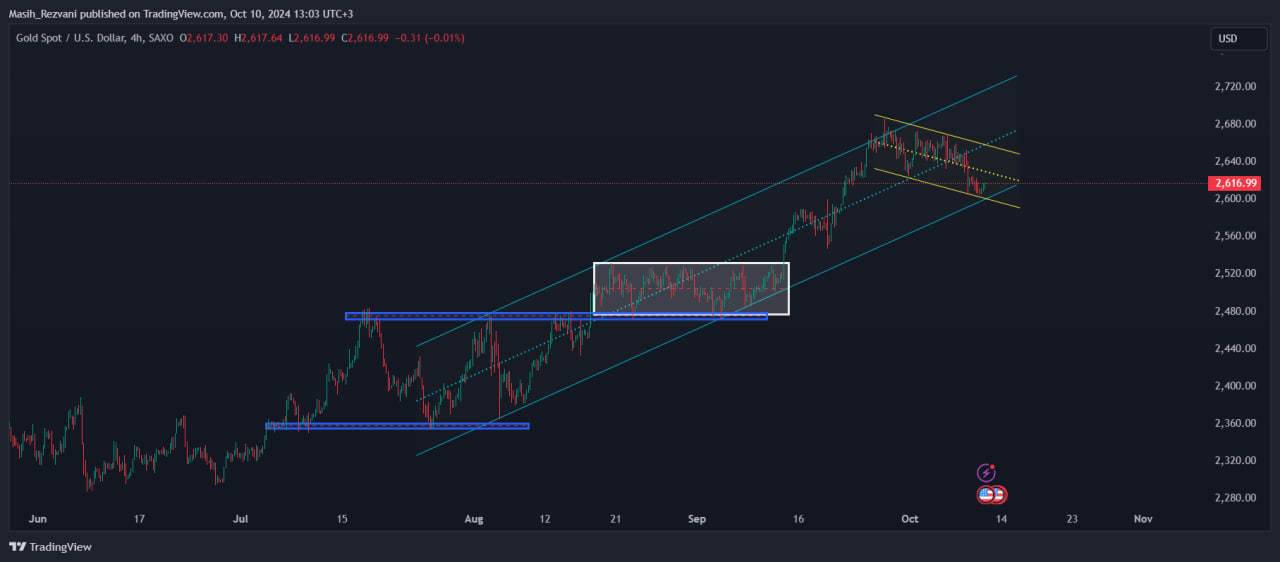
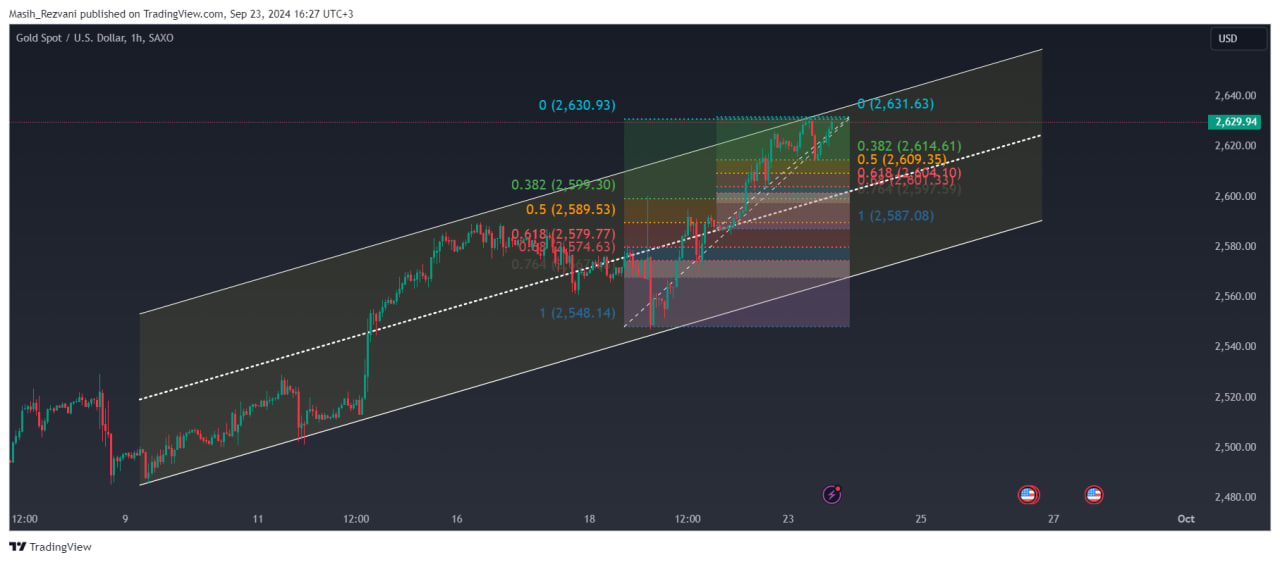
XAUUSD
In the technical analysis of gold, we are facing an exciting chart full of trading opportunities. Let’s take a closer and more detailed look at this analysis: 1. Main Trend:


About Dr.Rezvani Dr. Rezvani is one of the renowned and distinguished experts in the field of financial markets, especially Forex trading. With years of experience and precise analyses, Dr. Rezvani

Journaling in trading, according to Dr. Rezvani, is a systematic and structured process for documenting all aspects of a trade. This process includes recording all decisions, emotions, market conditions,

Introduction of Dr. Rezvani Dr. Rezvani is one of the leading experts in financial market analysis, with years of experience in trading and both technical and fundamental analysis. Through his

1. Concept and Definition of the Repo Market The Repo Market (Repurchase Agreement Market) refers to a market where temporary agreements for buying and selling securities are made. In these
Preface Dr. Rezvani is one of the leading analysts in financial markets and a specialist in trading and investment strategies. With a long-standing history in financial education and consultancy, he

Preface Dr. Rezvani, a prominent name in the field of economics and consulting specializing in energy and polymer products, is well-known for his nearly a decade of experience in analyzing