


XAUUSD
Updated Technical Analysis of Gold Chart (XAUUSD)
1. Fibonacci Levels:
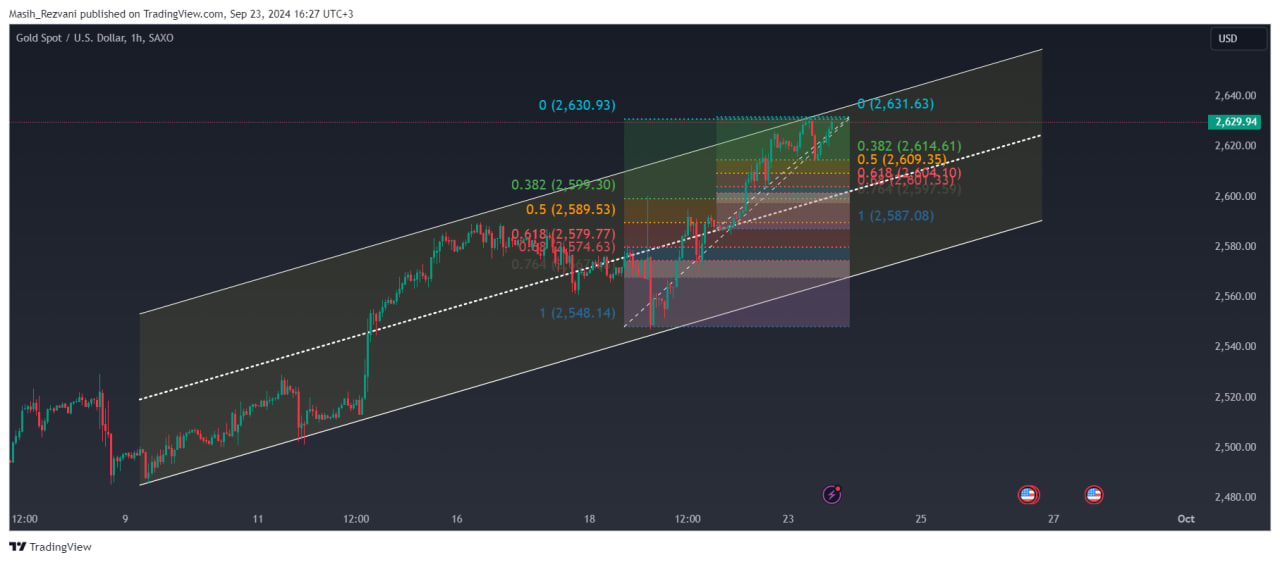
The chart clearly shows various Fibonacci levels based on the recent price movement. The 0.5 Fibonacci level at $2,609 and the 0.618 level at $2,604 serve as important support levels.
The 0.382 Fibonacci level at $2,614 acts as a near resistance.
Both the 0.618 and 0.5 levels on this chart act as key support and resistance levels, indicating that the price is fluctuating near these areas.
2. Ascending Channel Analysis:
The price movement remains within the ascending channel. The price is near the top of the channel (around $2,631), which acts as a strong resistance zone. This suggests a possible price reversal or correction.
The middle line of the channel has also provided support and resistance at previous price levels, and crossing this line indicates the continuation of either the uptrend or downtrend.
3. Key Levels in This Chart:
Support Levels:
Strong support is at the 0.618 Fibonacci level at $2,604. If the price corrects towards this level, we might see a price rebound.
The next support is at $2,589 (the 0.5 Fibonacci level from the broader move).
Resistance Levels:
The key resistance is around $2,631 (the top of the channel). If this level is broken, we might see a continuation of the uptrend.
4. Trade Suggestions:
Buy Trade:
If the price breaks above $2,631 (the top of the channel) and stabilizes, entering a buy position is reasonable. The price targets could be around $2,640 and then $2,660.
A stop loss should be placed below $2,620 to limit potential losses in case of a reversal.
Sell Trade:
If the price fails to break $2,631 and shows signs of reversing towards the lower part of the channel, a sell trade can be considered. In this case, the price targets could be around $2,614 (0.382 Fibonacci level) and then $2,604 (0.618 Fibonacci level).
The stop loss for a sell trade should be set above $2,635.
5. Risk Management:
Set the stop loss for a buy trade at $2,620 and for a sell trade above $2,635.
This analysis is based on the current chart, and it is recommended to pay special attention to economic news related to the Federal Reserve and macroeconomic data, as these can significantly impact the price of gold.