


Fractals
Fractals in technical analysis refer to specific patterns on a price chart that indicate potential reversal points and can be used to identify entry and exit points in trades. The concept of fractals generally comes from mathematics and complexity theory and has been applied in financial markets as well.
Key Features of Fractals on a Chart:
- Definition of Fractal:
- In technical analysis, a fractal is a pattern on a price chart that signifies turning points in the market. These patterns appear repeatedly on the chart and can indicate points of trend reversal.
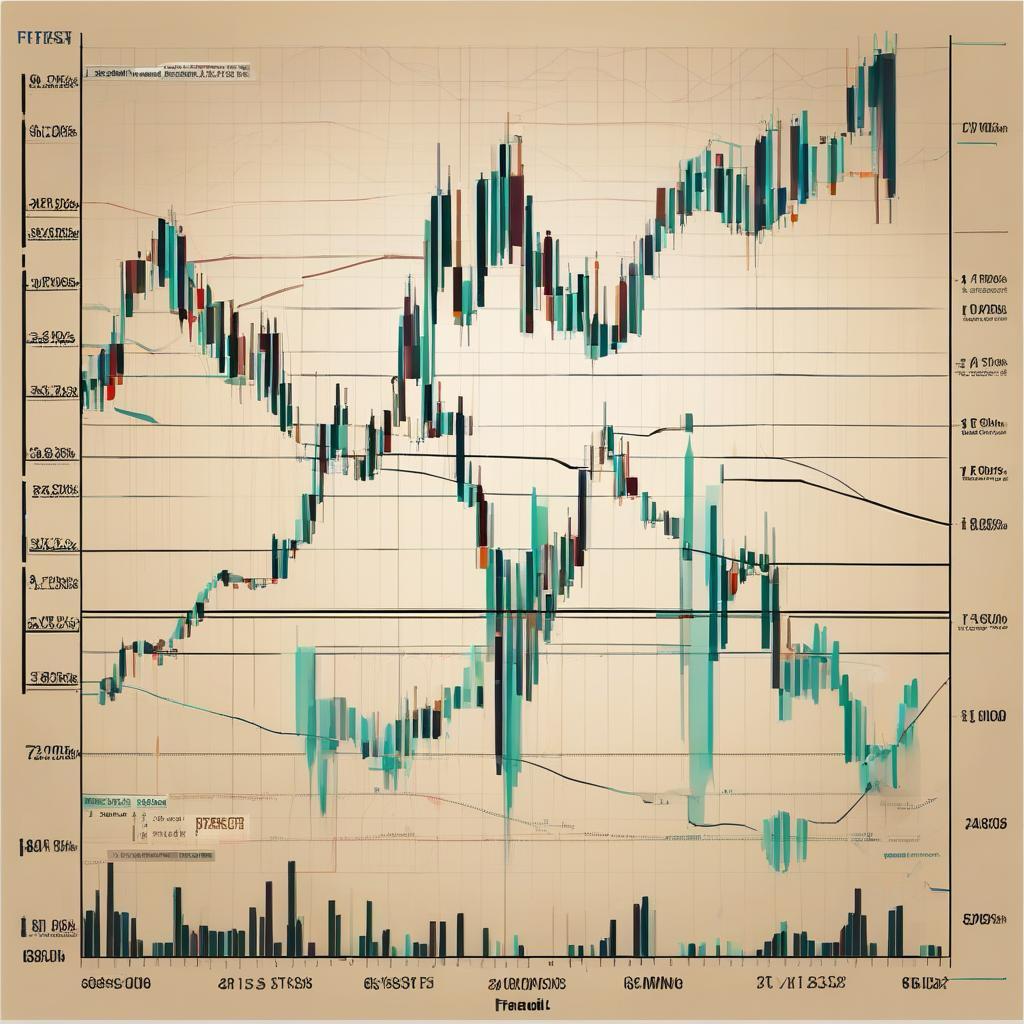
- Candlestick Fractals:
- On candlestick charts, fractals typically appear as specific patterns of candlesticks. For example, a bullish fractal may consist of three candlesticks where the middle candlestick is higher than the two adjacent candlesticks, while a bearish fractal includes a middle candlestick that is lower than the two adjacent candlesticks.
- Uses of Fractals:
- Identifying Reversal Points: Fractals can help identify price reversal points. Generally, bullish fractals indicate a potential upward shift, while bearish fractals suggest a potential downward shift.
- Assisting in Entry and Exit Points: Traders can use fractals to determine suitable points for entering or exiting trades.
- How to Identify Fractals:
- On a price chart, to identify fractals, look for specific patterns in the arrangement of candlesticks. For instance, in a bullish fractal, seek candlesticks where the highs and lows suggest a potential reversal point.
- Using technical analysis tools, such as fractal indicators in trading software, can aid in identifying and plotting these patterns.
- Common Fractal Examples:
- Bullish Fractal: Three candlesticks where the middle candlestick is higher in price compared to the adjacent candlesticks.
- Bearish Fractal: Three candlesticks where the middle candlestick is lower in price compared to the adjacent candlesticks.
Fractals are useful tools in technical analysis and can assist in identifying new trends and reversal points in the market. However, relying on them alone is not sufficient; they should be combined with other tools and techniques to achieve better results.